Find out what broke, fast.
Built on OpenTelemetry, so you keep your instrumentation and add nothing of ours to your servers.
From spike to fix.
Most tools stop at a graph and leave the rest to you. Nexovue carries one problem all the way through, from the first odd minute to the pull request that ends it.
It notices first
A service gets slower, fails more or loses traffic against its own daily and weekly normal. You set no thresholds, and new or quiet services stay quiet.
- p95, /checkout
- 2.1 s
- Normal, Tuesday 15:00
- 520 ms
- Sustained for
- 4 min
It says why
It joins deploys, errors and dependencies into one plain finding. Every claim links to the trace or log behind it, and a cause is called likely until it's proven.
Checkout is 4× slower than normal since 15:04.
- Started 90 seconds after deploy a41f2c9
- Slow span: one query on orders, scanning every row
It opens the case
The finding becomes a case with a timeline, kept in sync with GitHub Issues and Jira, so the work stays where your team already is.
Case: slow checkout
- 15:05 Opened from the finding
- 15:06 Issue created in GitHub
- 15:11 Assigned to the payments team
It tells your team
Email, Slack, Teams, Discord, PagerDuty or a webhook, straight away. An alert never waits for AI, and a guard stops one bad hour becoming a hundred messages.
#payments-oncall
Checkout is 4× slower than normal since 15:04. Open the case to see the evidence.
It suggests the fix
A proposed change on the finding, then a draft pull request. A person always approves it, and the part that reads your telemetry can't write anything.
+ CREATE INDEX orders_user_id_idx
+   ON orders (user_id);

Draft pull request. Waiting for your approval.You can ask it anything
Ask about your own system in plain words. It answers from your data and your past incidents, and shows where each answer came from.
Has this happened before?
Once, on 12 September, after a similar query. Here is that case and how it was closed.
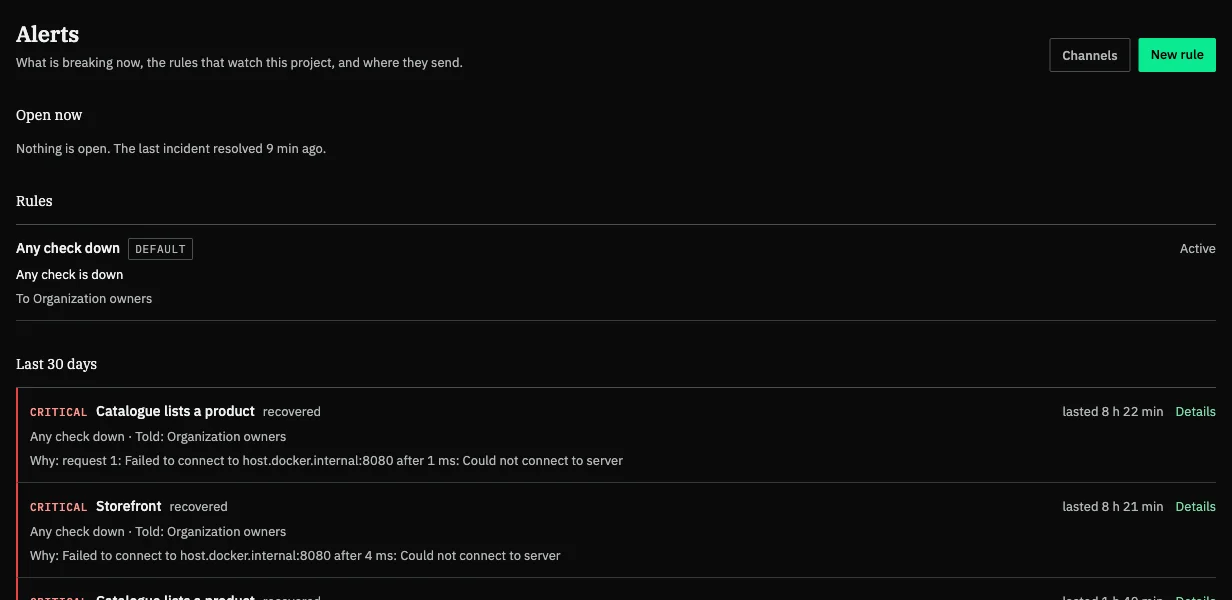
See everything in one place
- Ready the moment data arrives
- Services ranked by what needs you
- Metrics explorer with histograms and heatmaps
- A dashboard builder for the views only you need
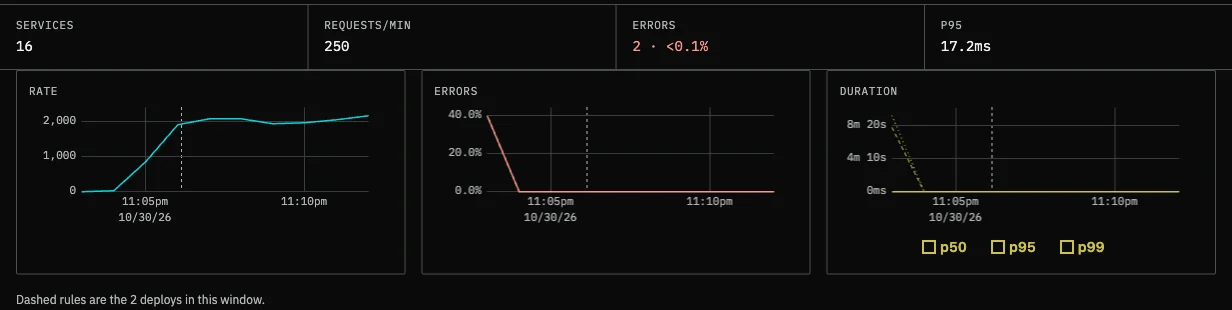
Follow a request end to end
- Trace list, waterfall and span detail
- Rate, latency and failures on every connection
- Logs with search, facets and live tail
- Continuous profiles (preview), through an OpenTelemetry Collector
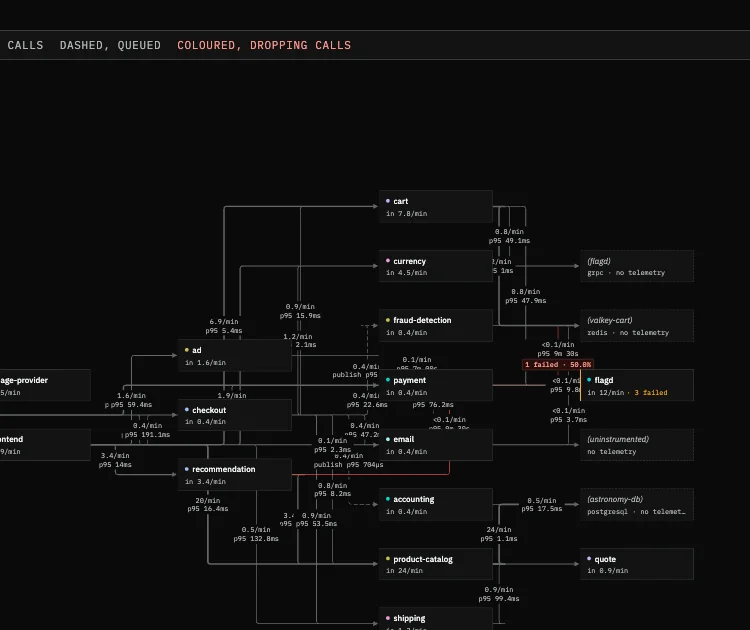
Catch what breaks
- Errors grouped with stack traces
- Each error linked to the deploy that started it
- Anomaly detection against each service's own normal
- SLO targets for what you've promised
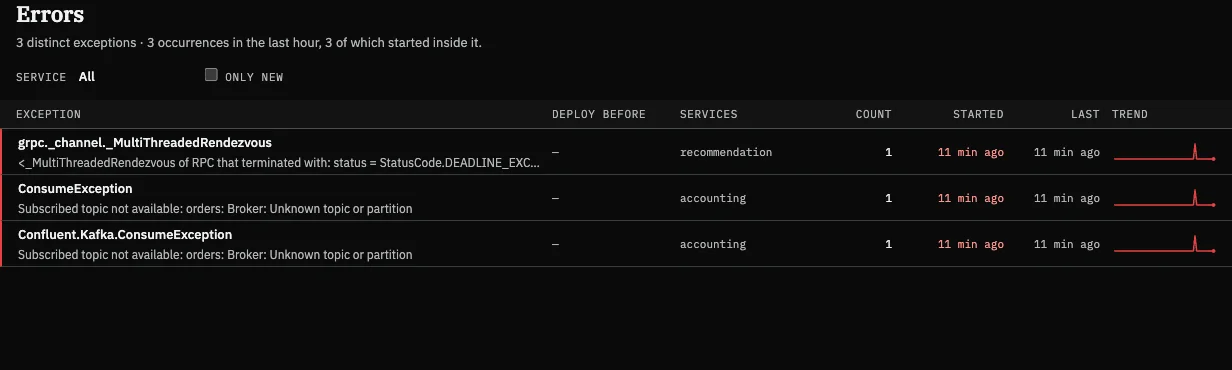
Watch it from outside
- Core Web Vitals and browser errors through an open SDK
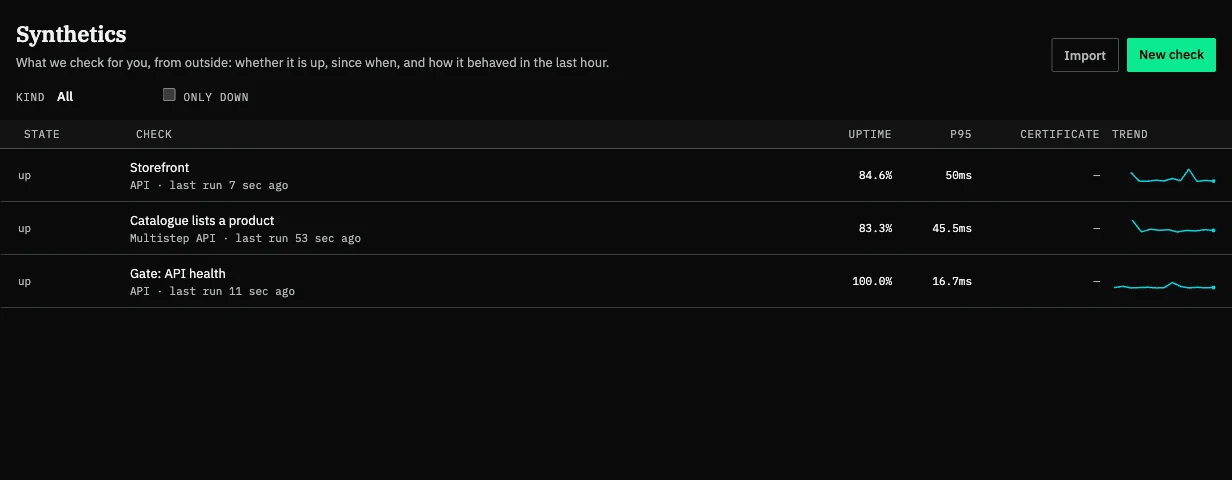
- API, multistep, TCP, DNS and heartbeat checks
- Certificate expiry warnings
- LLM call observability for your AI features
Keep the machines honest
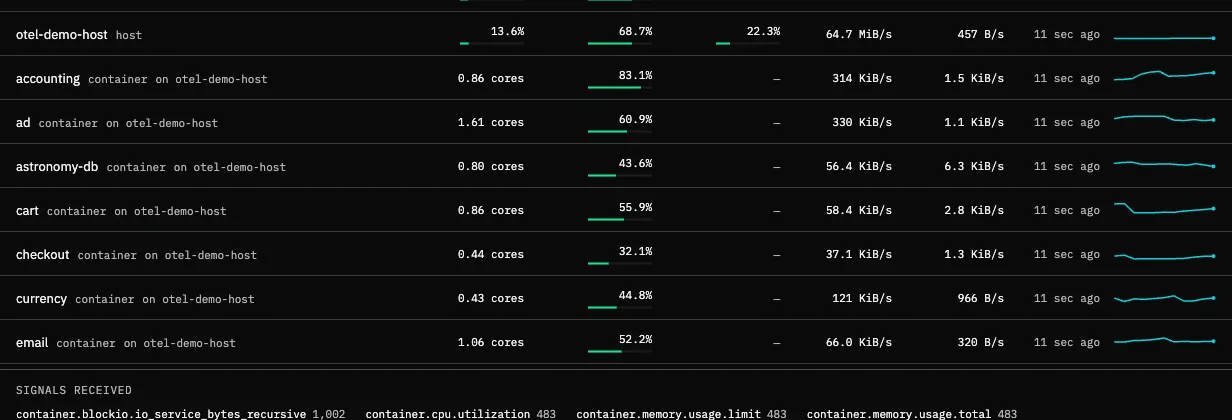
- CPU, memory, disk and network for each
- Database health and slow queries
- Deploy markers on service charts
Work as a team
- Alerts to email, Slack, Teams, Discord, PagerDuty and webhooks
- Cases that stay in sync with GitHub Issues and Jira
- Invites and roles, never priced per seat
- Two-factor sign-in, active sessions and an audit log